Category:Files that need updating (COVID-19)
Jump to navigation
Jump to search
English: Added by Template:current using {{Current|subset=COVID-19}}
Pages in category "Files that need updating (COVID-19)"
The following 4 pages are in this category, out of 4 total.
Media in category "Files that need updating (COVID-19)"
The following 200 files are in this category, out of 300 total.
(previous page) (next page)-
2019-coronavirus-china-2020-01-21.png 2,724 × 2,600; 267 KB
-
2019-nCoV in Wuhan.svg 512 × 410; 48 KB
-
2020 coronavirus patients in China.svg 988 × 638; 209 KB
-
20200119nCoV Update.png 1,090 × 1,078; 393 KB
-
Austria COVID-19 cases per capita.svg 512 × 274; 94 KB
-
Bihar Corona Map.png 565 × 533; 61 KB
-
Blocked Prefectures and Municipalities in mainland China due to COVID-19.png 6,246 × 4,937; 351 KB
-
Chart of UK COVID-19 daily new cases.png 4,418 × 2,274; 385 KB
-
Chart of UK COVID-19 daily new deaths.png 4,424 × 2,279; 428 KB
-
Cockfighting laws world map.svg 2,754 × 1,398; 1.13 MB
-
Corona.png 2,737 × 1,743; 246 KB
-
Coronavirus Brazil map.svg 512 × 534; 75 KB
-
Coronavirus deaths.png 2,935 × 1,761; 281 KB
-
Coronavirus infected persons per capita in Europe.svg 680 × 520; 749 KB
-
COVID-19 Active Cases per capita in Europe.svg 680 × 520; 754 KB
-
COVID-19 adenovirus vaccines authorization map.svg 2,754 × 1,398; 1.06 MB
-
COVID-19 Albania - Cases per capita (last 14 days).svg 512 × 855; 19 KB
-
COVID-19 Albania - Cases per capita.svg 512 × 855; 19 KB
-
COVID-19 Austria 7-day prevalence per capita (districts timeline).webm 1 min 53 s, 1,500 × 802; 3.02 MB
-
COVID-19 Austria cases per capita (districts timeline).webm 1 min 1 s, 1,000 × 534; 787 KB
-
COVID-19 Austria cases per capita (last 14 days).svg 512 × 274; 97 KB
-
CoViD-19 BG.svg 609 × 585; 74 KB
-
COVID-19 cases and deaths by age group in Finland.svg 900 × 720; 46 KB
-
COVID-19 cases and deaths by age group in Sweden.svg 900 × 720; 81 KB
-
COVID-19 Cases in Bosnia and Herzegovina per capita.svg 512 × 498; 45 KB
-
COVID-19 Cases in Cusco.svg 512 × 620; 81 KB
-
COVID-19 cases in Greater China.svg 1,000 × 850; 139 KB
-
COVID-19 cases in PRC-claimed territory by Prefectures.png 6,246 × 4,937; 842 KB
-
COVID-19 Cases in Sweden by Municipality (Total Number).svg 290 × 654; 252 KB
-
COVID-19 Croatia active cases per capita.svg 512 × 498; 26 KB
-
COVID-19 Croatia cases per capita.svg 512 × 498; 26 KB
-
COVID-19 Czech Republic - Cases per capita (last 14 days).svg 512 × 301; 75 KB
-
COVID-19 Czech Republic - Cases per capita.svg 512 × 301; 74 KB
-
COVID-19 Czech Republic 7-day prevalence per capita (timeline).webm 1 min 52 s, 1,020 × 597; 2.2 MB
-
COVID-19 death per infected in Europe.svg 680 × 520; 761 KB
-
COVID-19 deaths in Peru.svg 512 × 724; 80 KB
-
COVID-19 Deaths Prevalence in Alabama by county.svg 255 × 400; 51 KB
-
COVID-19 Deaths Prevalence in Alaska by county.svg 400 × 227; 136 KB
-
COVID-19 Deaths Prevalence in Arizona by county.svg 345 × 400; 20 KB
-
COVID-19 Deaths Prevalence in Arkansas by county.svg 400 × 349; 53 KB
-
COVID-19 Deaths Prevalence in California by county.svg 338 × 400; 74 KB
-
COVID-19 Deaths Prevalence in Colorado by county.svg 400 × 289; 41 KB
-
COVID-19 Deaths Prevalence in Connecticut by county.svg 400 × 291; 10 KB
-
COVID-19 Deaths Prevalence in Delaware by county.svg 166 × 400; 3 KB
-
COVID-19 Deaths Prevalence in District of Columbia by county.svg 322 × 400; 709 bytes
-
COVID-19 Deaths Prevalence in Florida by county.svg 400 × 399; 56 KB
-
COVID-19 Deaths Prevalence in Georgia by county.svg 347 × 400; 96 KB
-
COVID-19 Deaths Prevalence in Hawaii by county.svg 400 × 261; 10 KB
-
COVID-19 Deaths Prevalence in Idaho by county.svg 252 × 400; 44 KB
-
COVID-19 Deaths Prevalence in Illinois by county.svg 226 × 400; 57 KB
-
COVID-19 Deaths Prevalence in Indiana by county.svg 260 × 400; 45 KB
-
COVID-19 Deaths Prevalence in Iowa by county.svg 400 × 261; 38 KB
-
COVID-19 Deaths Prevalence in Kansas by county.svg 400 × 205; 41 KB
-
COVID-19 Deaths Prevalence in Kentucky by county.svg 400 × 169; 76 KB
-
COVID-19 Deaths Prevalence in Louisiana by county.svg 400 × 377; 56 KB
-
COVID-19 Deaths Prevalence in Maine by county.svg 267 × 400; 27 KB
-
COVID-19 Deaths Prevalence in Maryland by county.svg 400 × 210; 22 KB
-
COVID-19 Deaths Prevalence in Massachusetts by county.svg 400 × 247; 22 KB
-
COVID-19 Deaths Prevalence in Michigan by county.svg 340 × 400; 46 KB
-
COVID-19 Deaths Prevalence in Minnesota by county.svg 350 × 400; 50 KB
-
COVID-19 Deaths Prevalence in Mississippi by county.svg 246 × 400; 52 KB
-
COVID-19 Deaths Prevalence in Missouri by county.svg 400 × 356; 62 KB
-
COVID-19 Deaths Prevalence in Montana by county.svg 400 × 230; 67 KB
-
COVID-19 Deaths Prevalence in Nevada by county.svg 265 × 400; 16 KB
-
COVID-19 Deaths Prevalence in New Jersey by county.svg 211 × 400; 20 KB
-
COVID-19 Deaths Prevalence in New Mexico by county.svg 359 × 400; 26 KB
-
COVID-19 Deaths Prevalence in New York by county.svg 400 × 305; 56 KB
-
COVID-19 Deaths Prevalence in North Carolina by county.svg 400 × 152; 63 KB
-
COVID-19 Deaths Prevalence in North Dakota by county.svg 400 × 238; 30 KB
-
COVID-19 Deaths Prevalence in Ohio by county.svg 370 × 400; 52 KB
-
COVID-19 Deaths Prevalence in Oklahoma by county.svg 400 × 197; 47 KB
-
COVID-19 Deaths Prevalence in Oregon by county.svg 400 × 297; 40 KB
-
COVID-19 Deaths Prevalence in Pennsylvania by county.svg 400 × 230; 45 KB
-
COVID-19 Deaths Prevalence in South Carolina by county.svg 400 × 318; 39 KB
-
COVID-19 Deaths Prevalence in South Dakota by county.svg 400 × 248; 34 KB
-
COVID-19 Deaths Prevalence in Tennessee by county.svg 400 × 97; 62 KB
-
COVID-19 Deaths Prevalence in Texas by county.svg 400 × 380; 160 KB
-
COVID-19 Deaths Prevalence in Utah by county.svg 320 × 400; 28 KB
-
COVID-19 Deaths Prevalence in Vermont by county.svg 243 × 400; 15 KB
-
COVID-19 Deaths Prevalence in Virginia by county.svg 400 × 173; 87 KB
-
COVID-19 Deaths Prevalence in Washington by county.svg 400 × 263; 39 KB
-
COVID-19 Deaths Prevalence in West Virginia by county.svg 400 × 355; 36 KB
-
COVID-19 Deaths Prevalence in Wisconsin by county.svg 375 × 400; 42 KB
-
COVID-19 fertőzések 1 havi változása 100.000 főre vetítve.png 1,481 × 561; 262 KB
-
COVID-19 Finland timeline.en.svg 1,440 × 900; 502 KB
-
COVID-19 Finland timeline.fi.svg 1,440 × 900; 453 KB
-
COVID-19 Germany - Cases per capita (last 14 days).svg 512 × 715; 201 KB
-
COVID-19 Germany - Cases per capita.svg 512 × 715; 192 KB
-
COVID-19 Germany 7-day prevalence per capita (timeline).webm 1 min 54 s, 921 × 921; 3.22 MB
-
COVID-19 in Florida - Weekly Case Positivity Rates.svg 423 × 287; 34 KB
-
COVID-19 in Pakistan - Case Fatality Rate.svg 2,750 × 2,000; 1,008 KB
-
COVID-19 in Pakistan - Confirmed Cases per 100K.svg 2,750 × 2,000; 1,008 KB
-
COVID-19 in Pakistan - Confirmed Cases.svg 2,750 × 2,000; 1,008 KB
-
COVID-19 in Pakistan - Deaths per 100K.svg 2,750 × 2,000; 1,008 KB
-
COVID-19 in Pakistan - Deaths.svg 2,750 × 2,000; 1,008 KB
-
COVID-19 inactivated vaccines authorization map.svg 2,754 × 1,398; 1.06 MB
-
COVID-19 India Test centres.svg 1,574 × 1,792; 208 KB
-
COVID-19 Italy - Cases per capita (last 14 days).svg 512 × 653; 128 KB
-
COVID-19 Italy - Cases per capita.svg 512 × 653; 126 KB
-
COVID-19 Netherlands - 7-day prevalence per capita (timeline).webm 1 min 46 s, 866 × 1,030; 3.22 MB
-
COVID-19 Ontario Testing Rates.png 1,432 × 590; 315 KB
-
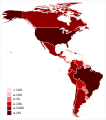
COVID-19 Outbreak America Map.svg 1,064 × 1,201; 529 KB
-
COVID-19 Outbreak Cases in Algeria.svg 4,853 × 4,739; 58 KB
-
COVID-19 Outbreak Cases in Brazil.svg 512 × 510; 2.38 MB
-
COVID-19 Outbreak Cases in Estonia.svg 512 × 299; 76 KB
-
COVID-19 Outbreak Cases in Europe.svg 680 × 520; 748 KB
-
COVID-19 Outbreak Cases in India.svg 512 × 583; 170 KB
-
COVID-19 Outbreak Cases in New Zealand (DHB Totals).svg 650 × 846; 138 KB
-
COVID-19 Outbreak Cases in New Zealand (DHB Totals, per capita).svg 650 × 846; 139 KB
-
COVID-19 Outbreak Cases in Oceania.svg 512 × 327; 245 KB
-
COVID-19 Outbreak Cases in Peru.svg 512 × 724; 80 KB
-
COVID-19 Outbreak Cases in Sweden by Number with Legend.svg 340 × 580; 73 KB
-
COVID-19 Outbreak Cases in Sweden by Number.svg 320 × 580; 74 KB
-
COVID-19 Outbreak Cases in Sweden per capita with Legend.svg 340 × 580; 73 KB
-
COVID-19 Outbreak Cases in Sweden.svg 1,000 × 2,264; 77 KB
-
COVID-19 Outbreak Cases in the Czech Republic-Graph.svg 585 × 344; 193 KB
-
COVID-19 Outbreak Cases in the United States.svg 512 × 317; 44 KB
-
COVID-19 Outbreak Cases in Tunisia.svg 1,352 × 2,684; 125 KB
-
COVID-19 Outbreak Deaths in New Zealand (DHB Totals).svg 650 × 846; 139 KB
-
COVID-19 Outbreak lockdowns.svg 2,754 × 1,398; 1.1 MB
-
COVID-19 outbreak Taiwan per capita cases map townships.svg 1,440 × 2,055; 1.2 MB
-
COVID-19 outbreak Taiwan per capita cases map.svg 1,440 × 2,055; 426 KB
-
COVID-19 outbreak the Netherlands per capita cases map.svg 512 × 603; 132 KB
-
COVID-19 Outbreak World Map per Capita.svg 2,921 × 1,500; 2.78 MB
-
COVID-19 Outbreak World Map Total Deaths per Capita.svg 2,754 × 1,398; 1.24 MB
-
COVID-19 Outbreak World Map-Confirmed.svg 2,921 × 1,500; 1.73 MB
-
COVID-19 Outbreak World Map.svg 2,921 × 1,500; 1.72 MB
-
COVID-19 pandemic cases in Turkey (province-level density).svg 960 × 469; 291 KB
-
COVID-19 pandemic cases per million in Turkey (province-level density).svg 1,024 × 500; 389 KB
-
COVID-19 Pandemic Deaths in Algeria.svg 4,853 × 4,739; 58 KB
-
COVID-19 pandemic deaths in Turkey (province-level density).svg 960 × 469; 291 KB
-
COVID-19 pandemic Thailand per capita cases map.svg 1,051 × 1,849; 369 KB
-
COVID-19 per capita cases map of Finland.svg 294 × 503; 130 KB
-
COVID-19 per capita cases map of Somaliland.svg 1,102 × 960; 134 KB
-
COVID-19 per capita deaths map of Finland.svg 294 × 503; 103 KB
-
COVID-19 Portugal - Cases per capita (last 14 days).svg 512 × 700; 139 KB
-
COVID-19 Portugal - Cases per capita.svg 512 × 700; 137 KB
-
COVID-19 Prevalence in Alabama by county.svg 255 × 400; 51 KB
-
COVID-19 Prevalence in Alaska by county.svg 400 × 227; 136 KB
-
COVID-19 Prevalence in Arizona by county.svg 345 × 400; 20 KB
-
COVID-19 Prevalence in Arkansas by county.svg 400 × 349; 53 KB
-
COVID-19 Prevalence in Boston by neighborhood.png 780 × 850; 95 KB
-
COVID-19 Prevalence in California by county.svg 338 × 400; 74 KB
-
COVID-19 Prevalence in Colorado by county.svg 400 × 289; 41 KB
-
COVID-19 Prevalence in Connecticut by county.svg 400 × 291; 10 KB
-
COVID-19 Prevalence in Delaware by county.svg 166 × 400; 3 KB
-
COVID-19 Prevalence in District of Columbia by county.svg 322 × 400; 709 bytes
-
COVID-19 Prevalence in Florida by county.svg 400 × 399; 56 KB
-
COVID-19 Prevalence in Georgia by county.svg 347 × 400; 96 KB
-
COVID-19 Prevalence in Hawaii by county.svg 400 × 261; 12 KB
-
COVID-19 Prevalence in Idaho by county.svg 252 × 400; 44 KB
-
COVID-19 Prevalence in Illinois by county.svg 226 × 400; 57 KB
-
COVID-19 Prevalence in Indiana by county.svg 260 × 400; 45 KB
-
COVID-19 Prevalence in Iowa by county.svg 400 × 261; 38 KB
-
COVID-19 Prevalence in Kansas by county.svg 400 × 205; 41 KB
-
COVID-19 Prevalence in Kentucky by county.svg 400 × 169; 76 KB
-
COVID-19 Prevalence in Louisiana by county.svg 400 × 377; 56 KB
-
COVID-19 Prevalence in Maine by county.svg 267 × 400; 27 KB
-
COVID-19 Prevalence in Maryland by county.svg 400 × 210; 22 KB
-
COVID-19 Prevalence in Massachusetts by county.svg 400 × 247; 22 KB
-
COVID-19 Prevalence in Michigan by county.svg 340 × 400; 46 KB
-
COVID-19 Prevalence in Minnesota by county.svg 350 × 400; 50 KB
-
COVID-19 Prevalence in Mississippi by county.svg 246 × 400; 52 KB
-
COVID-19 Prevalence in Missouri by county.svg 400 × 356; 62 KB
-
COVID-19 Prevalence in Montana by county.svg 400 × 230; 67 KB
-
COVID-19 Prevalence in Nebraska by county.svg 400 × 184; 40 KB
-
COVID-19 Prevalence in Nevada by county.svg 265 × 400; 16 KB
-
COVID-19 Prevalence in New Hampshire by county.svg 208 × 400; 13 KB
-
COVID-19 Prevalence in New Jersey by county.svg 211 × 400; 20 KB
-
COVID-19 Prevalence in New Mexico by county.svg 359 × 400; 26 KB
-
COVID-19 Prevalence in New York by county.svg 400 × 305; 56 KB
-
COVID-19 Prevalence in North Carolina by county.svg 400 × 152; 63 KB
-
COVID-19 Prevalence in North Dakota by county.svg 400 × 238; 30 KB
-
COVID-19 Prevalence in Ohio by county.svg 370 × 400; 52 KB
-
COVID-19 Prevalence in Oklahoma by county.svg 400 × 197; 47 KB
-
COVID-19 Prevalence in Oregon by county.svg 400 × 297; 40 KB
-
COVID-19 Prevalence in Pennsylvania by county.svg 400 × 230; 45 KB
-
COVID-19 Prevalence in Rhode Island by county.svg 256 × 400; 4 KB
-
COVID-19 Prevalence in South Carolina by county.svg 400 × 318; 39 KB
-
COVID-19 Prevalence in South Dakota by county.svg 400 × 248; 34 KB
-
COVID-19 Prevalence in Tennessee by county.svg 400 × 97; 62 KB
-
COVID-19 Prevalence in Texas by county.svg 400 × 380; 160 KB
-
COVID-19 Prevalence in the United States by county.svg 990 × 627; 1.56 MB
-
COVID-19 Prevalence in Utah by county.svg 320 × 400; 28 KB
-
COVID-19 Prevalence in Vermont by county.svg 810 × 810; 17 KB
-
COVID-19 Prevalence in Virginia by county.svg 400 × 173; 87 KB
-
COVID-19 Prevalence in Washington by county.svg 400 × 263; 39 KB
-
COVID-19 Prevalence in West Virginia by county.svg 400 × 355; 36 KB
-
COVID-19 Prevalence in Wisconsin by county.svg 375 × 400; 42 KB
-
COVID-19 Prevalence in Wyoming by county.svg 400 × 314; 19 KB
-
COVID-19 RNA and DNA vaccines authorization map.svg 2,754 × 1,398; 1.05 MB
-
COVID-19 rolling 14day Prevalence in Alabama by county.svg 255 × 400; 51 KB
-
COVID-19 rolling 14day Prevalence in Alaska by county.svg 400 × 227; 136 KB


.svg/72px-COVID-19_Albania_-_Cases_per_capita_(last_14_days).svg.png)

.svg/120px-COVID-19_Austria_cases_per_capita_(last_14_days).svg.png)

.svg/120px-COVID-19_Bosnia_and_Herzegovina_-_Cases_per_capita_(last_14_days).svg.png)


.svg/53px-COVID-19_Cases_in_Sweden_by_Municipality_(Total_Number).svg.png)


.svg/120px-COVID-19_Czech_Republic_-_Cases_per_capita_(last_14_days).svg.png)


.svg/86px-COVID-19_Germany_-_Cases_per_capita_(last_14_days).svg.png)


.svg/94px-COVID-19_Italy_-_Cases_per_capita_(last_14_days).svg.png)



.svg/92px-COVID-19_Outbreak_Cases_in_New_Zealand_(DHB_Totals).svg.png)
.svg/92px-COVID-19_Outbreak_Cases_in_New_Zealand_(DHB_Totals%2C_per_capita).svg.png)


.svg/92px-COVID-19_Outbreak_Deaths_in_New_Zealand_(DHB_Totals).svg.png)


.svg/120px-COVID-19_pandemic_cases_in_Turkey_(province-level_density).svg.png)
.svg/120px-COVID-19_pandemic_cases_per_million_in_Turkey_(province-level_density).svg.png)

.svg/120px-COVID-19_pandemic_deaths_in_Turkey_(province-level_density).svg.png)


.svg/88px-COVID-19_Portugal_-_Cases_per_capita_(last_14_days).svg.png)


