Category:English-language pie charts
Jump to navigation
Jump to search
Subcategories
This category has only the following subcategory.
*
- English-language SVG pie charts (167 F)
Media in category "English-language pie charts"
The following 200 files are in this category, out of 876 total.
(previous page) (next page)-
Credit default swaps vs total nominals plus debt.png 1,852 × 1,646; 78 KB
-
CRNYHS Corporate work study breakdown.png 600 × 464; 132 KB
-
Csccdegreepie.png 1,022 × 1,274; 131 KB
-
CSCS Usage by Field Graph 11.tif 1,110 × 936; 621 KB
-
CSCS Usage by Field Graph 23.png 500 × 390; 27 KB
-
CSCS Usage by Institution Graph 11.tif 1,245 × 950; 620 KB
-
CSCS Usage by Institution Graph 23.png 523 × 417; 30 KB
-
CW BB pie chart encoding script zh East Asian.png 731 × 652; 230 KB
-
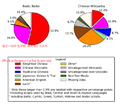
CW BB pie chart encoding script.png 708 × 613; 232 KB
-
Dar sad actinomycet.png 1,314 × 924; 108 KB
-
Dark matter pie.jpg 240 × 180; 5 KB
-
Data breach published chart.png 338 × 322; 26 KB
-
Day County South Dakota Pie Chart New Wiki Version.pdf 1,650 × 1,275; 74 KB
-
DCSDRevenue.JPG 724 × 451; 163 KB
-
Demand for plastic resin in europe 2017.png 830 × 474; 31 KB
-
Demographics.jpg 308 × 275; 15 KB
-
Designfortheenvironment fig2.png 1,556 × 1,720; 744 KB
-
Detriotecon.jpg 539 × 317; 30 KB
-
Deuel County South Dakota Pie Chart New Wiki Version.pdf 1,650 × 1,275; 74 KB
-
Diagram marknadsandelar 2011 09.png 680 × 500; 6 KB
-
Difficult patrolling elements.png 1,882 × 1,042; 43 KB
-
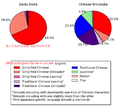
Digital TV (UK) Q4 2006 All sets.png 480 × 375; 23 KB
-
Digital TV in UK homes Q3 2006 all sets.png 399 × 189; 3 KB
-
Direct Services Provided by First 5 LA.png 873 × 526; 152 KB
-
Dist vent.png 1,558 × 501; 31 KB
-
Distr-byserv.jpg 452 × 420; 18 KB
-
Distribuição doAndroid.png 962 × 722; 40 KB
-
Distribution epa service by category 2009.png 820 × 429; 6 KB
-
Distribution of CD 2.jpg 775 × 474; 23 KB
-
Distribution of ethnic groups in Crimea 2001.png 564 × 619; 57 KB
-
Distribution of recurrent spontaneous abortion according to causes.jpg 1,280 × 720; 59 KB
-
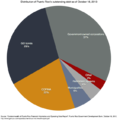
Distribution-puerto-rico-outstanding-debt.png 627 × 635; 73 KB
-
Diversity lincoln academy.png 521 × 385; 47 KB
-
Domestic End Uses of Water.jpg 761 × 519; 39 KB
-
Donationamountbreakdown.png 700 × 525; 178 KB
-
Dongducheon-landuse-chart.png 600 × 463; 28 KB
-
Douglas County Pie Chart New Wiki Version.pdf 1,650 × 1,275; 24 KB
-
Drom pie chart.jpg 1,243 × 665; 108 KB
-
Dwarf planet masses.png 528 × 403; 16 KB
-
Economic activity of chattisham 2011.png 1,276 × 913; 433 KB
-
Edit pie chart.jpg 565 × 329; 31 KB
-
Editing wikipedia while female.png 558 × 467; 9 KB
-
EGRPS Demographics chart 2018-19.png 783 × 659; 241 KB
-
Elect use 06.jpg 475 × 212; 18 KB
-
Electricity Generation in Idaho.jpg 1,204 × 676; 148 KB
-
Electricity production in Romania 2018.png 800 × 650; 39 KB
-
Ellipse Graphic.jpg 621 × 265; 55 KB
-
Employees chart.jpg 439 × 300; 66 KB
-
Employment by Industry in the US-2013.png 1,441 × 976; 95 KB
-
Employment by sector in Greater Lowell in 2010.png 831 × 511; 39 KB
-
EN distribution epa service by category 2011.png 820 × 429; 6 KB
-
EN epa service 2008 distribution by categories.png 911 × 623; 51 KB
-
End Uses Pie 1.png 805 × 599; 44 KB
-
Energy clay.png 1,020 × 267; 30 KB
-
Energy consumption in Nigeria.png 479 × 468; 22 KB
-
Energy glass.png 1,020 × 267; 34 KB
-
Energy hemp.png 1,020 × 267; 33 KB
-
Energy pp.png 1,020 × 267; 32 KB
-
England ethnicity estimates 2009.jpg 1,105 × 581; 76 KB
-
English dialects.png 300 × 224; 7 KB
-
English dialects1997.png 250 × 180; 15 KB
-
Enwiki ArbCom 2008 total vote breakdown.png 287 × 270; 28 KB
-
ES Pie.JPG 420 × 318; 23 KB
-
Estimated ownership of US Treasury securities by category 0608.jpg 510 × 320; 56 KB
-
Ethic California Organized Pie.png 878 × 704; 62 KB
-
Ethnic composition of Muslim Americans.png 272 × 272; 31 KB
-
Ethnic groups in Baltic States by share of total population.jpg 954 × 720; 218 KB
-
Ethnic groups in Darenth .jpg 938 × 544; 60 KB
-
Ethnic Groups in Hunton 2011.png 668 × 412; 74 KB
-
Ethnic groups of Muslim Americans.png 337 × 170; 10 KB
-
EUexpenditure2004.png 794 × 390; 16 KB
-
EUrevenuesources2004.png 650 × 344; 16 KB
-
European immigration to the United States 1881-1940.png 1,566 × 1,102; 46 KB
-
Example pie chart.png 500 × 400; 28 KB
-
Facebook users by age pie.jpg 1,023 × 943; 46 KB
-
Facebook users by age.PNG 628 × 486; 26 KB
-
Faculty makeup by race or ethnicity.pdf 1,275 × 1,650, 2 pages; 163 KB
-
FacultyPieChart.jpg 453 × 307; 19 KB
-
False balance in climate science.png 1,202 × 752; 42 KB
-
False Pass 2000 Census Occupations.jpg 600 × 600; 29 KB
-
FarmlandinEU2.gif 658 × 460; 17 KB
-
Federal Receipts by Source, 2010.jpg 458 × 471; 59 KB
-
Female employment type in Kirton, Suffolk 1881.jpg 451 × 259; 19 KB
-
Female occ 1881.jpg 1,161 × 601; 33 KB
-
Female Occupation in 1881.png 570 × 373; 16 KB
-
Female Occupations, Little Torrington 1881.png 380 × 283; 11 KB
-
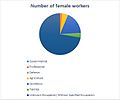
Female workers in 1881.jpg 480 × 398; 24 KB
-
FHS enrollment by ethnicity (pie chart).png 771 × 459; 77 KB
-
Fig.2 Wikiversity A15.JPG 478 × 280; 19 KB
-
Fig.3 Wikiversity A15.JPG 488 × 294; 14 KB
-
Fig2 CWSRFsFund.jpg 1,090 × 1,732; 122 KB
-
Fig3 ServedCommunities.jpg 1,109 × 1,755; 102 KB
-
Figure4-300x188.jpg 300 × 188; 11 KB
-
Finningham Age Structure Pie Chart.jpg 1,152 × 648; 36 KB
-
Finningham Age Structure.jpg 481 × 287; 24 KB
-
Finningham Occuppation Males 1881.jpg 489 × 337; 33 KB
-
Florida Power and Light Generation by Fuel Type (2014).jpeg 1,200 × 800; 52 KB
-
FOIR survey student areas of study.png 1,677 × 1,188; 163 KB
-
FOIR survey student enrollment status.png 1,747 × 1,232; 129 KB
-
FOIR survey student languages.png 1,214 × 1,212; 173 KB
-
Food system energy.jpg 1,502 × 854; 66 KB
-
Forexcorporate (en).pdf 1,752 × 1,239; 169 KB
-
Fraction of vertebrates within the animal kingdom.jpg 527 × 171; 9 KB
-
Fraport Anreise modalsplit 2006.png 932 × 651; 21 KB
-
Freight goods according to mode of transportation 2010.png 468 × 235; 9 KB
-
Frequency of Job Types in 1881.jpg 480 × 285; 16 KB
-
FSANetCost2006.png 786 × 414; 70 KB
-
FullFrontal-Americans with Female Relatives.png 1,280 × 720; 250 KB
-
FXCP123.pdf 1,752 × 1,239; 165 KB
-
FY13 Shareholder.jpg 675 × 443; 53 KB
-
Fy2009spendingbycategory2.png 870 × 628; 77 KB
-
FY2023-Consolidated-Annual-Report-UAP-Oct2023 (page 7 crop) 01.jpg 1,451 × 1,017; 189 KB
-
FY2023-Consolidated-Annual-Report-UAP-Oct2023 (page 7 crop) 02.jpg 1,506 × 1,082; 172 KB
-
GA resolutions 2006.JPG 651 × 604; 85 KB
-
Gao 1950 Ethnics figures azawad.JPG 736 × 468; 29 KB
-
Gao ethnicity chart 2009.tiff 353 × 282; 26 KB
-
GAO-07-560-MonetizationChart.gif 1,516 × 1,893; 71 KB
-
GASEIOLCA1.JPG 292 × 474; 22 KB
-
Gasification Energy Use.JPG 567 × 327; 22 KB
-
Gasification GWP Chart.JPG 567 × 328; 22 KB
-
Gasification Toxic Chart.JPG 567 × 331; 22 KB
-
Gender gap in Wikipedia (animation).gif 1,331 × 821; 238 KB
-
Geographical distribution of bilingual Canadians.JPG 600 × 525; 54 KB
-
GeothermalEIOLCA2.JPG 293 × 477; 22 KB
-
German Soldiers in the American Revolution.png 334 × 273; 24 KB
-
Gesundheit THA Aerzte Region.jpg 470 × 278; 35 KB
-
Gesundheit THA Apotheker Region.jpg 472 × 282; 36 KB
-
Gesundheit THA MTA Region.jpg 469 × 277; 36 KB
-
Gesundheit THA Nurse Region.jpg 469 × 277; 41 KB
-
Gesundheit THA Zahnaerzte Region.jpg 468 × 280; 36 KB
-
Ghana Trustworthiness of Media.jpg 445 × 310; 126 KB
-
Gib Challenge Points by User Dec 2nd.png 648 × 417; 65 KB
-
Giving in the US 2009.png 338 × 336; 76 KB
-
Global average human diet and protein composition and usage of crop-based products.webp 2,117 × 1,598; 176 KB
-
Global distribution of aviation fuel use.jpg 2,389 × 1,199; 133 KB
-
Global Distribution of Wealth v3.jpg 612 × 481; 62 KB
-
Global Distribution of Wealth.jpeg 2,000 × 1,655; 132 KB
-
Global food systems GHG emissions in 2020.png 602 × 501; 112 KB
-
Global Soybean Meal Consumption (11717587375).jpg 1,532 × 1,201; 794 KB
-
Google Chart.gif 913 × 587; 10 KB
-
Google News Chart.gif 913 × 587; 10 KB
-
Grant Co Pie Chart New Wiki Version.pdf 1,650 × 1,275; 75 KB
-
Graph government spending 2022 Switzerland.png 663 × 373; 31 KB
-
Graph Hip fracture.png 484 × 292; 10 KB
-
Graph male female OT.JPG 589 × 387; 32 KB
-
Graph of largest earthquakes 1906-2005.png 1,824 × 1,378; 71 KB
-
Graph showing occupations in different sectors in 1881.jpg 481 × 288; 31 KB
-
Great Canfield 2011 Occupational Data.jpg 527 × 355; 74 KB
-
Great Southern product sales pie chart.jpg 963 × 631; 22 KB
-
Green clay.gif 567 × 502; 31 KB
-
Green glass.gif 565 × 550; 36 KB
-
Green hemp.gif 567 × 512; 32 KB
-
Green pp.gif 566 × 521; 31 KB
-
Guernsey10 population chart.jpg 354 × 257; 19 KB
-
Gusen-chart corrected.PNG 685 × 561; 40 KB
-
Gusen-chart.PNG 708 × 494; 9 KB
-
Hamilton college chart.jpg 510 × 355; 26 KB
-
Hamlin County South Dakota Pie Chart New Wiki Version.pdf 1,650 × 1,275; 75 KB
-
Happiness pie chart based on Lyubomirsky book.png 902 × 527; 27 KB
-
Hawaii Electricity Generation Sources Pie Chart.svg 342 × 376; 4 KB
-
HawaiiPopByRace1959.png 609 × 354; 7 KB
-
HawaiiPopByRace2005.png 609 × 365; 8 KB
-
Health Insurance Coverage of the Non-Elderly Population, 2011.png 409 × 231; 35 KB
-
HemenwayStudyTeenGunAttitudes.gif 712 × 556; 9 KB
-
Hennepin Co Pie Chart No Text Version.pdf 1,650 × 1,275; 6 KB
-
Heveningham age.png 481 × 289; 10 KB
-
How much I care animated pie chart 0 to 360.gif 515 × 569; 62 KB
-
Hubbard County MN Pie Chart New Wiki Version.pdf 1,650 × 1,275; 24 KB
-
Human body composition- better colours.JPG 291 × 254; 9 KB
-
Human body composition.JPG 561 × 604; 15 KB
-
Humblebundlebycount.png 324 × 296; 12 KB
-
Humblebundlebydonation.png 500 × 300; 11 KB
-
IANA IPv4 Address Space Registry.png 753 × 627; 29 KB
-
Ilketshall 1881 male occupation.png 560 × 409; 17 KB
-
Ilketshall, St. Andrew Female occupation 1881.png 558 × 356; 15 KB
-
Illogical.png 308 × 249; 8 KB
-
Impunity trade Unions colombia.PNG 263 × 213; 27 KB
-
Incidence According to Age Group in the USA during 2010.png 337 × 333; 11 KB
-
Incidence of ovarian cancers by histopathology.png 2,674 × 3,155; 753 KB
-
Incineration Energy Use.JPG 667 × 313; 19 KB
-
Incineration GWP Chart.JPG 667 × 315; 21 KB
-
Incineration Toxic Chart.JPG 666 × 322; 22 KB
-
Income America.png 653 × 428; 6 KB
-
Incunabula distribution by language.png 1,394 × 950; 764 KB
-
Incunabula distribution by region.png 1,394 × 950; 770 KB
-
India handset data.jpg 359 × 304; 22 KB
-
India Internet-Segments.jpg 399 × 318; 20 KB
-
India Mobile access.jpg 362 × 218; 14 KB
-
India smartphones.jpg 362 × 218; 13 KB
-
Individual Interest-Distribution Chart for Toothpaste.jpg 844 × 910; 327 KB
-
Internet users.JPG 561 × 514; 43 KB
-
Iowa Electricity Generation Sources Pie Chart 2019.png 575 × 643; 100 KB






_Q4_2006_All_sets.png/120px-Digital_TV_(UK)_Q4_2006_All_sets.png)


.png/120px-Disclosure_of_political_contributors_to_Elections_Canada_in_2009_(all_federal_parties_and_riding_associations).png)


_by_EU_member_country.png/120px-Distribution_of_contributions_to_the_European_Stability_Mechanism_(ESM)_by_EU_member_country.png)




.png/120px-FHS_enrollment_by_ethnicity_(pie_chart).png)


%2C_Fiscal_Year_2013_(15773254074).jpg/120px-thumbnail.jpg)


.jpeg/120px-Florida_Power_and_Light_Generation_by_Fuel_Type_(2014).jpeg)



.pdf/page1-120px-Forexcorporate_(en).pdf.jpg)


_01.jpg/120px-FY2023-Consolidated-Annual-Report-UAP-Oct2023_(page_7_crop)_01.jpg)
_02.jpg/120px-FY2023-Consolidated-Annual-Report-UAP-Oct2023_(page_7_crop)_02.jpg)


.gif/120px-Gender_gap_in_Wikipedia_(animation).gif)


.jpg/120px-Global_Soybean_Meal_Consumption_(11717587375).jpg)


.svg/120px-Gross_Domestic_Product_of_California_2008_(millions_of_current_dollars).svg.png)


