Category:Pie charts of incidence and malignancy of cancers
Jump to navigation
Jump to search
Media in category "Pie charts of incidence and malignancy of cancers"
The following 35 files are in this category, out of 35 total.
-
Appendix neoplasms by incidence and prognosis.png 1,570 × 739; 182 KB
-
Appendix neoplasms by incidence and prognosis.svg 879 × 414; 14 KB
-
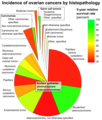
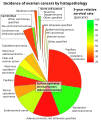
Incidence of ovarian cancers by histopathology.png 2,674 × 3,155; 753 KB
-
Incidences and prognoses of adrenal tumors.png 1,005 × 547; 75 KB
-
Liver tumor types in adults by relative incidence.png 615 × 335; 66 KB
-
Liver tumor types in adults by relative incidence.svg 1,174 × 639; 12 KB
-
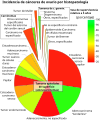
Ovarian cancers by histopathology-es.svg 1,711 × 2,019; 49 KB
-
Ovarian cancers by histopathology.svg 1,604 × 1,893; 43 KB
-
Ovarian tumors by incidence and cancer risk.png 2,153 × 1,093; 341 KB
-
Ovarian tumors by incidence and cancer risk.svg 1,309 × 665; 21 KB
-
Pie chart of cancer incidences.png 424 × 284; 26 KB
-
Pie chart of colorectal polyp etiologies.png 2,417 × 1,651; 355 KB
-
Pie chart of colorectal polyp etiologies.svg 1,208 × 826; 15 KB
-
Pie chart of histopathologic types of invasive breast cancer.png 2,058 × 1,195; 290 KB
-
Pie chart of histopathologic types of invasive breast cancer.svg 926 × 538; 18 KB
-
Pie chart of incidence and malignancy of pigmented skin lesions.png 3,169 × 1,915; 749 KB
-
Pie chart of incidence and malignancy of pigmented skin lesions.svg 1,584 × 958; 41 KB
-
Pie chart of incidence and prognosis of histopathologic breast cancer types.png 2,795 × 1,220; 414 KB
-
Pie chart of relative incidences of endometrial carcinoma-es.png 810 × 396; 91 KB
-
Pie chart of relative incidences of endometrial carcinoma.png 1,363 × 667; 82 KB
-
Pie chart of relative incidences of thyroid cancers.png 1,103 × 647; 100 KB
-
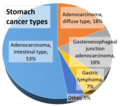
Pie chart of stomach cancer types by relative incidence.png 733 × 649; 84 KB
-
Pie chart of thyroid cancer types by incidence.png 941 × 631; 68 KB
-
Relative incidence of colorectal cancers.svg 1,570 × 566; 44 KB
-
Relative incidence of pancreatic neoplasms.png 1,270 × 653; 111 KB
-
Relative incidence of parotid tumors.png 1,142 × 663; 78 KB
-
Relative incidence of submandibular tumors.png 1,160 × 671; 78 KB
-
Relative incidences of testicular tumors.png 971 × 643; 86 KB
-
Renal tumors by relative incidence and prognosis.png 1,776 × 950; 204 KB
-
Renal tumors by relative incidence and prognosis.svg 1,217 × 651; 25 KB
-
Small intestinal cancers by incidence and prognosis.jpg 2,687 × 1,294; 543 KB
-
Small intestinal cancers by incidence and prognosis.svg 1,727 × 832; 40 KB


